Introduction
Hey friends, I hope you’re all doing well! Welcome to another update on Athena. In my previous videos, I highlighted that Athena’s price action was moving within a downward channel on the daily timeframe. Today, we’re going to analyze the recent developments, key support and resistance levels, and potential breakout targets for Athena.
Athena’s Price Action – Key Levels to Watch
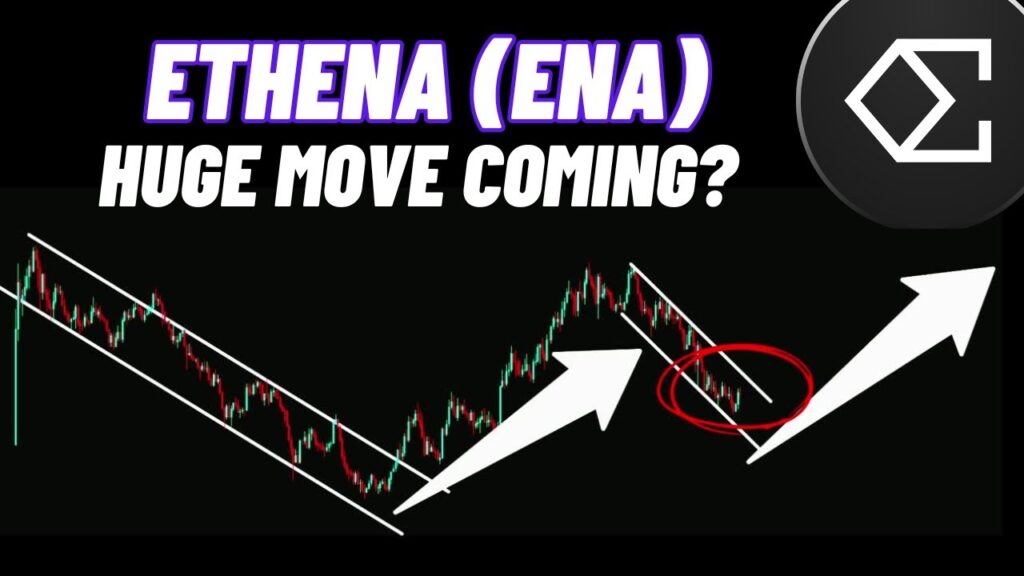
If we take a look at Athena’s live daily timeframe chart, we can see that it has gone through multiple phases of price movement, forming different chart patterns.
- Breakout from Long-Term Downtrend:
Initially, Athena broke out of a long-term descending channel, signaling a potential trend reversal. However, it then entered a rising wedge pattern, a formation that typically indicates a potential pullback. - Breakdown from Rising Wedges:
- The first rising wedge was broken to the upside, but Athena quickly entered another rising wedge pattern.
- This second wedge ultimately broke to the downside, causing the price to drop further.
- I previously mentioned that the target for this breakdown was 34.44 cents, and as expected, Athena not only reached this level but even fell slightly below it.
- Formation of a New Downward Channel:
- As Athena moved lower, it formed a new downward channel, confirming the continuation of the bearish trend.
- The price has now reached a critical long-term support level at 34.44 cents.
Current Market Position – Is a Reversal Possible?
Athena has now hit the crucial 34.44 cent support zone, which has played a significant role in past price movements:
- This level previously acted as resistance before flipping into strong support multiple times.
- After testing this support, Athena has bounced off it but is now facing rejection from the downtrend channel’s resistance once again.
At this point, we need to carefully watch whether Athena holds this support or breaks below it.
Potential Scenarios for Athena’s Next Move
Scenario 1: Bullish Breakout from the Downward Channel
If Athena can gain momentum and break above the downtrend channel, we could see a strong rally toward the top of the channel, which is currently around $1.25.
- Target for breakout: $1.25
- Major resistance: The upper boundary of the downtrend channel
- Confirmation of a trend reversal: If Athena breaks above $1.25, the next major target would be around $1.52.
Scenario 2: Bearish Breakdown Below 34.44 Cents
If Athena fails to hold the 34.44 cent support, then we could see a further drop toward the next key support zone between 22.7 cents and 19.44 cents.
- Target for breakdown: 19.44 – 22.7 cents
- Historical support levels: This zone has provided strong support in previous price cycles. If tested again, we may see another bounce.
- Worst-case scenario: If Athena breaks below this range, the next major support is much lower, which could signal further bearish action.
Historical Context – Why This Support is Critical
Looking at historical price movements, 34.44 cents has been a key level multiple times:
- Previously acted as resistance before Athena broke above it.
- Flipped into strong support and prevented further declines in past corrections.
- Now, once again, it is serving as a crucial make-or-break level for the current market structure.
Institutional & Retail Sentiment – Is Athena Oversold?
Another key factor to consider is whether Athena is currently oversold. Similar to how Bitcoin and the overall crypto market have entered oversold territory, Athena is showing signs that a reversal could be near.
Technical Indicators Suggest a Potential Rebound
- Relative Strength Index (RSI): Currently near oversold levels, meaning buyers could step in soon.
- Volume Analysis: A slight increase in buying pressure at support, but we need more confirmation.
- Moving Averages: Athena is trading below the 200-day moving average, indicating a long-term downtrend, but breaking above it would be a strong bullish signal.
Trading Strategy & Next Steps
For Short-Term Traders:
- Watch for a breakout above the downtrend channel’s resistance before entering a trade.
- If support at 34.44 cents holds, it could be a potential buy zone with a target toward $1.25.
- If Athena breaks below 34.44 cents, wait for confirmation before considering a short trade toward 22.7 – 19.44 cents.
For Long-Term Investors:
- Accumulation opportunity? Given that Athena is near a long-term support level, this could be a good accumulation zone for long-term holders.
- Potential upside? If the crypto market recovers, Athena could see a significant rally toward $1.52 and beyond.
Final Thoughts & Key Takeaways
✅ Athena is currently at a major long-term support level at 34.44 cents.
✅ If this support holds, we could see a breakout toward $1.25 and eventually $1.52.
✅ If support breaks, the next major zone is between 22.7 and 19.44 cents.
✅ The overall crypto market is in an oversold phase, meaning a rebound could be coming.
As always, this is not financial advice—just my personal analysis. Always do your own research before making any investment decisions.
Final Words: What’s Next for Athena?
With the market showing early signs of recovery, Athena’s next few days will be crucial. If we get a strong bounce, the upside potential is significant. However, if the 34.44 cent support fails, we could see another drop before a true reversal.
I’ll be closely monitoring Athena’s price action, so stay tuned for more updates. Take care, and see you in the next one!